With several years worth of data on automated terminal performance, Yvo Saanen and Joan Rijsenbrij assess the best handling systems available
It is hard to imagine the automotive or food industries without automation, or what the cost of a simple glass would be if it had to be hand-blown. In manufacturing industries, automation guarantees quality, productivity, repetitiveness, and control over operations.
However, automation is received with reluctance and doubt in the container industry. Container handling has a lot of similarities with manufacturing. Repetition and simplicity of tasks within well-defined physical boundaries seem to be appropriate for automation.
Working at a port – with its three shifts, noisy conditions, industrial and polluted areas – is not the typical boy’s dream. Still, unions fight to the last men to secure their position.

Automation in container terminals has not really taken off. With ECT in the Netherlands (1993), and more recently CTA in Germany (2002), the breed of fully automated terminals is a rare species.
However, things are changing: automation is being taken more seriously. In many of the terminal design projects, automated handling system components are considered. Most well-informed terminal operators know that automation will bring substantial cost savings, and will lead to a predictable and controllable operation.
Is it possible to define the best handling system concept for a medium-sized to large terminal? Is this possible in a business environment that demands high productivity – berth productivity on mainline vessels above 150-200 gross moves per hour, and crane productivities of 35 gross moves and beyond – and suffers from high labour cost, and high societal demands for environmental friendliness, efficient land utilisation, safety and security?

Figure 1
Are these factors key for considering automation? Yes and no. Yes, in the sense that automation will be easier to sell to risk-averse decision makers when these factors apply, but no in the sense that there are many other reasons for automation.
Otherwise, the hi-tech factories of Philips and Nokia in China would not exist. Automation offers more, so which handling system concepts are eligible for implementation in medium to large sized terminals?
It is a good habit to look to the past when designing the future. So what can be learned from the two fully automated terminals at ECT and CTA?
The two terminals are highly successful, proven by their customers. Both terminals are profitable and are operating at capacity – up to 95% stack density. Their productivity may not be state-ofthe-art, but their cost-efficiency is exemplary, especially when considering their environment.
ECT is operating three terminals on one peninsula with a total of 38 quay cranes, more than 130 automated stacking cranes (ASCs), and a fleet of 260 automated guided vehicles (AGVs). The annual volume is around 3.5m containers, and the performance is typical for the Hamburg-Le Havre range, where only Antwerp excels.
CTA is smaller, but still a decent size terminal, with 14 quay cranes – 12 of which are semiautomated double trolley cranes – with 52 ASCs, and around 70 AGVs. As with ECT’s Delta terminals, CTA operates at capacity, which equals around 1.4m containers.
A special feature of CTA is the ASC design, which consists of two RMGs of different sizes that are able to pass each other. While ECT relies on a single RMG per stack module, CTA has redundancy built in.
What could improve in the design with hindsight? ECT, now at capacity, could use a second ASC since the stacks were heightened (the original design was based on one-over-one high only, and they are now at one-over-four high), thus allowing for simultaneous waterside and landside operations. Also the AGVs are the older (slower) types.
Finally, the operation between the quay crane legs (in gauge) makes the AGV cycle longer than at CTA, where hand off takes place in the crane’s backreach. At CTA, the amount of equipment for high peak operations may be considered too low to achieve high productivity (40+). Since the land is fully occupied, additional ASCs are not an option.
Today’s design on new automated terminals embroiders on a theme. Systems with separated waterside and landside operations are being looked at, with the storage area in the middle, operated by ASC perpendicular to the wharf (see Figure 1).
So can a definition be made of the best handling system concept for a medium-sized to large terminal? The best way to do this is to compare a number of handling systems on their merits, and draw conclusions form those. However, for specific cases, the best option may be different due to local circumstances, economic reasons, or just as a result of belief or disbelief in a particular concept.
The method of assessment is based on comparing the different available systems on their productivity-cost ratio under similar circumstances. Put simply: which system offers the best balance between the operational cost and performance, while still meeting today’s minimum performance demands, in terms of storage capacity and handling capacity.
In order to answer this question, a definition needs to be made of the circumstances under which the comparison will take place, as well as the minimum demands. The first criterion is that the terminal is medium to large – with an end capacity of 2m teu upwards. As a state-of-the-art terminal, it will be equipped with 10 quay cranes only, which should be capable of running at least 4,000 hours per year. Berth productivity demands should be a minimum of 200 moves per hour – with five or six cranes – in order to sustain the coming 10-20 years. This translates back to minimum gross crane productivities of 35 moves per hour. By gross, this includes all delays between the start and end of the operation. Adding up all productive crane hours, this easily exceeds 2m teu, assuming a teu factor of 1.6. The berth length equals 1km, and the available space for stacking equals 1km x 500m (50ha) – a nice and rectangular terminal, typical for a reclaimed area.
Another important factor for terminal design is the transhipment rate, which is tricky because it may be difficult to predict. In order to find the most robust systems, it is necessary to analyse the handling systems under different transhipment ratios, The transhipment ratio determines to a large degree the peak handling demands at waterside and landside – respectively the demand from vessel and gate/rail traffic. In this particular case, gate traffic is only accounted for. Based on typical conditions, it is necessary to define the following relation between the transhipment ratio and the peaks at the landside.

Figure 2
The methodology consists of two main tools: dynamic simulation to analyse the productivity under realistic operational conditions; as well as cost analysis, translating productivity and working hours into operational costs and investments. The simulation is compiled of two parts: the yard handling systems are compared by analysing a single stack module under maximum workload (always a job available); the transport systems are compared under typical peak conditions in a terminal. Both simulations will be conducted under varying transhipment ratios – varying balances between waterside and landside demand.
The final step of the comparison is the cost analysis, which consists only of the discriminating factors, all other things being equal. The cost analysis also has two parts: first, the investment side, then the operational cost side. Both should be assessed in conjunction, although the risk averse among us, focus on the first and the pay back or NPV method only. The life span of a terminal is at least 20 years, so the operational costs have more weight than the short-term oriented NPV. Both have been applied to get the complete picture. The operational cost consists of running costs (energy and maintenance), capital costs and depreciation. Labour costs mainly differentiate the automated transportation systems and the manned ones.

Figure 3: The considered alternatives: stacking systems
Three contenders have been identified, all of which are ASCs, and all of which will shortly be deployed or have already been deployed in real operations. The three options are: the twin-ASC (scheduled for Rotterdam’s forthcoming Euromax terminal, and the first four units are now operating at Antwerp Gateway); the cross-over twin-ASC (now operating at Hamburg’s CTA); and the cross-over tri-ASC (being installed now at Hamburg’s CTB). The single-ASC, (operating at ECT) has not been included since it is important to have redundancy in the system.
It is assumed that all small cranes can potentially run at the same speeds, acceleration and deceleration (for gantry, trolley, and hoist), although individual suppliers may claim differently, or choose differently. The large cranes are slower because of their dimensions.
All concepts span 10 containers wide, five high and 40teu long, giving a stacking capacity of 2,000teu per block. The width of the twin-ASC is 35 metres and the cross-over ASCs are 42.5 metres wide (the additional space being necessary for the cross-over functionality).
The interchange zones are similar in terms of design, all equipped with an interchange for AGVs at the waterside (five lanes), and for road trucks/terminal trucks at the landside (five lanes).
The considered alternatives: transportation systems
Although the market for automated transportation equipment is still small – in comparison with the market for manned equipment – there are various systems on the market. Not all are proven yet – a major requirement from many operators – but they are available for a conceptual battle on similar terms.
The following options are available:
- The good old AGV (Gottwald), currently running in Rotterdam and Hamburg. The dieselelectric version has been used.
- The automated shuttle/straddle carrier (Kalmar) currently running in Brisbane.
- The cassette AGV (TTS, diesel-hydraulic), not yet operational, but several trials in ports have been conducted. This AGV carries cassettes around, and is able to drop and pick-up cassettes by itself.
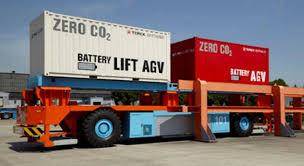
- The lift AGV (Gottwald, also diesel-electric), based on the existing AGV but with the possibility to pick-up and drop a container by itself at the interchange of the ASC. This concept allows mixing with existing fleets of AGVs, as the machines are almost identical, apart from a lifting platform on top of the AGV.
- The manual shuttle carrier (Kalmar, Noell); a one-over-one straddle carrier, which will soon be running in several places (Antwerp, Norfolk), and currently in operation in Southampton.
The tractor-trailer has been left out, although feasible, since it has quite similar characteristics to an AGV – coupled interchange at ASC and quay crane.
The five alternatives have been compared under similar operational conditions: an operation with 10 quay cranes (single trolley, single hoist) and 25 stacking modules, equipped with twin-ASCs. Each handling system has been tuned to utilise its capabilities to the full extent – decoupling and usage of the buffers at the stacking crane, efficient placing of empty cassettes, efficient job dispatching of transportation vehicles and stacking cranes. The cassette AGV and the lift AGV do not decouple at the quay crane. Although being an opportunity, there was a greater need for empty cassette transportation, only decreasing performance when decoupling at the quay crane. The lift AGV requires platforms where the containers can be placed, and these would have to move with the quay crane, which was considered too complex in practice. Of course, all systems apart from the traditional AGV decouple at the ASC transfer point.
Comparison of ASC systems
In order to determine the maximum capability of a single stack module, a model was created in which there is a continuous demand from the waterside (on average 50% loading, 50% discharge), generated by two quay cranes. The waterside transportation is executed by means of AGVs. As the number is sufficient, there is no waiting time of the ASC for horizontal transportation.
The landside demand is varied, to represent the different types of cargo flows, from true transhipment – for which this terminal layout is certainly not meant, a parallel layout would be more appropriate – to 100% import/export. In all scenarios the landside ASCs are allowed to support the waterside ASCs.
In the cross-over scenarios, the large ASC can actually access the interchange zone, in the twin configuration, the landside ASC can only pre-position the export containers closer to the waterside. Of course, the busier the landside ASCs get (with an increase of landside demand), the lesser the ASCs can support the waterside. In the configuration with three ASCs, the small landside ASC only does landside moves (shuffles and productive moves), and the large ASC can support both waterside and landside.

Figure 4
The job assignment is a critical component in order to make each of these three configurations productive. It considers empty travelling (which should be avoided), job urgency (sequence), and tries to use idle time for pre-productive moves. Another important control component is the conflict avoidance and the passing algorithm for the cross-over ASCs. When to pass and when to wait is a delicate issue. For more information regarding the actual decision-making, refer to Saanen and Valkengoed (2006).
What it does boil down to is shown in Figure 3, where the productivity of each configuration is shown dependent on the landside demand. In addition, shuffle moves and pre-position moves have been executed, but they are not shown in the graph.
What can be concluded from Figure 3? First, that per stack module the tri RMG is the most productive in all cases. However, the contribution of the third crane is at best two productive moves per hour compared with the twin RMG. The twin cross-over RMG outperforms the twin RMG by a maximum of 1.2 moves per hour (in case of 100% transhipment). In the range of 55- 70% transhipment they are almost equal, and below 50% transhipment the twin RMG delivers higher productivity per stack module. Were the performance of the twin RMG corrected for the lesser width (15%), the twin RMG would be the best performing one. This would be important in case the width of the terminal is a limiting factor.
When translating these figures into performance under peak conditions in a terminal, these values cannot be used, because the utilisation per stack module varies in time, and therefore the performance under maximum workload is typically much higher than under entire terminal conditions – and here most static calculations fail.
In Figure 4 the main result of the comparison of transportation systems can be seen: the quay crane productivity depending on the number of vehicles deployed. In all cases, there was global pooling of vehicles, allowing empty travel to be minimised. This is obvious for the automated equipment types, less obvious for the manned machines. The maximum achievable productivity is approximately 45 container moves per hour, starting with an average cycle time of the quay cranes of 80 seconds, and 85 seconds when operating in backreach (only in case of the manned shuttle carriers).
What can be concluded from Figure 4? First of all, that all systems can deliver a similar productivity by deploying sufficient vehicles, and in case of adequate control software. So the perception that automated systems cannot deliver the same productivity as manually driven machines, is not true – it requires more vehicles though.
The second conclusion is that the effect of decoupling is considerable: when just comparing the traditional AGV with the lift-AGV, a performance increase of up to 30% can be observed, or a reduction of vehicles (at comparative performance) of up to 50% (at 40 boxes per hour). The cassette AGV also shows an improvement compared with the AGV, but less so, as a result of the empty cassette moves (the average driving distance per container is almost 40% higher). Also the process at the quay crane takes quite long due to the necessity to lower the cassette onto the ground to avoid impact loads on the vehicle.
Another study showed that in case of more transfer points at the quay crane (four instead of the two used in this study) the latter effect could be minimised. However, more than two transfer points are not feasible in case of larger crane clusters, as used in this study (up to seven cranes in one cluster). The only systems with three transfer points per quay crane are the shuttle carriers, manned and automated.
Finally: what is needed to achieve 40 boxes per hour? In this particular terminal setting, 27 manned shuttle carriers (pooled), 30 automated shuttle carriers, 33 lift AGVs, 50 cassette AGVs and 65 AGVs. The cost analysis departs from a few assumptions: The labour cost per operating man-hour are assumed to be €40 and the cost of fuel €0.80 per litre. The prices of the vehicles (including platforms for the lift-AGVs and cassettes for the cassette-AGVs) are:
- AGV: €380,000
- Lift-AGV: €500,000
- Cassette-AGV: €565,000
- Automated shuttle carrier: €960,000
- Manned shuttle carrier: €480,000
The fuel consumption for the various vehicles (which determine to a large extent the operating cost per hour) is also a result from the simulation, based on the engine characteristics. Also considered are the additional investments in software required for the automated systems (up to €2.3m additionally). Capex and Opex are shown in Figure 5.
What can be concluded? First of all, all automated systems are obviously less expensive than the manned alternative, even considering the higher capital expenses. This means that the additional investment for an automated system (ranging from t7m for the lift-AGV to €19m for the automated shuttle carrier) will be earned back in two (lift-AGV) to five years (automated shuttle carrier). Secondly, the least interesting automated system, despite its capability to fully decouple is the automated shuttle carrier, mainly due to its high price, and relatively high maintenance costs.

Figure 5
There is still a lot of ground to cover for fully automated terminals. However, with the lessons learned from past implementations (lack of decoupling, little software robustness, equipment specifications), the case for automated terminals is strong. Economically, there is no question that full automation pays off in a short period of time. Performance-wise, automated systems require more equipment, but they can achieve similar performance levels as manned equipment. Prerequisite is intelligent, flexible and robust software, which has to be proved in practice yet. Finally, what about the social impact of automation? Yes, in direct labour, jobs will be lost, or more moves per labour hour will be moved. On the other hand, it requires more intelligence in the construction and maintenance of equipment and software, also creating more interesting jobs. Furthermore, can the automotive industry be thought of without automation? So, in order to stay competitive, automation in yard handling and horizontal transportation needs to be considered, and balanced against other interests.
Dr Yvo Saanen is MD of consultancy firm TBA, and Joan Rijsenbrij is professor in large scale transportation systems in the faculty of mechanical, maritime and materials engineering at the Delft University of Technology
This article has been published on cargosystems.net in June 2007.
Share this
Lean and mean terminal design benefits from advanced modelling