Introduction
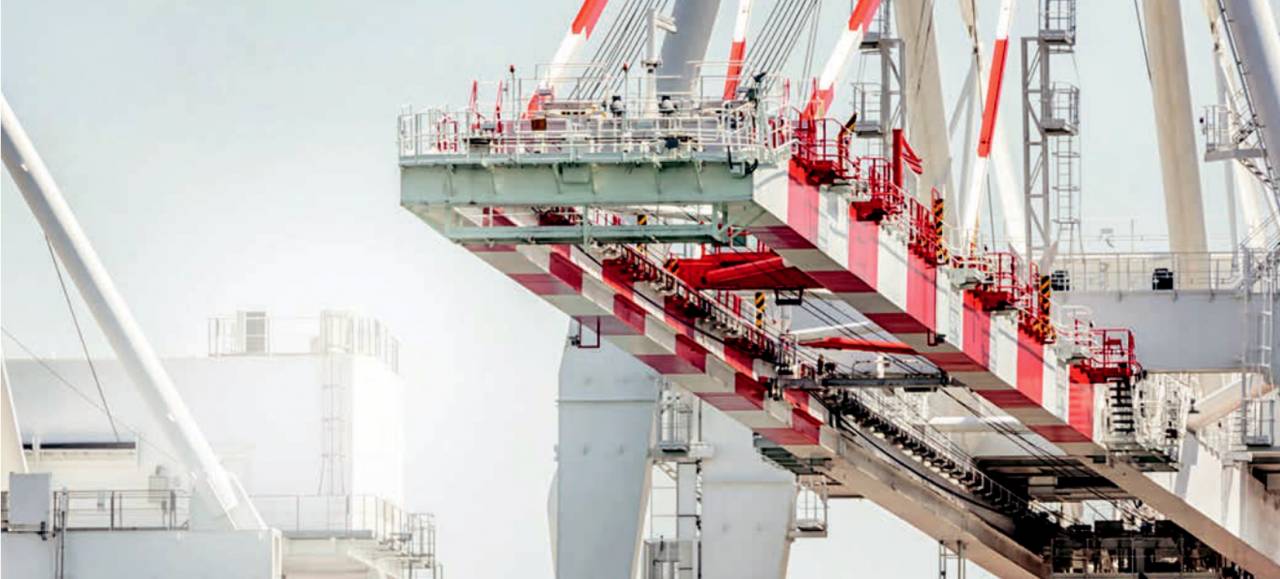
The trend of ever-increasing ship size has not past unnoticed in the last decade or so. Probably we have not seen the end yet of this development with 20,000 TEU ships on the drawing tables. Driving by the desire to reduce operating costs (of which fuel costs are the most relevant), and fostered by an overcapacity of ship capacity in the market, those larger ships also sail slower, much slower. Where speeds in the range of 20 – 25 knots was commonplace 5 years ago, speeds now have dropped to 15 – 17 knots. Although the reduction of fuel costs are obvious – see for instance Dijkstra (2011), Notteboom (2004), reporting a reduction of 23% per container slot comparing an 12,000 TEU vessel to a 4,000 TEU vessel, and Wright (2011) reporting Maersk’s Triple E Class (18,000 TEU) to be 26% more cost efficient than the current E class (15,000 TEU) -, a recent research into supply chain costs (Streng, 2012) indicates that this is not obvious for the entire supply chain. With an increase in capital deployed (as strings are now operated with more ships due to the elongated round trip) the capital cost per TEU moved has increased even considering the increase in slot size of the vessels. Furthermore, due to the increase in transportation duration, the capital costs and insurance of goods transported have gone up. Further cost increase could be accounted for in the increase in time to market. Fast moving goods (such as consumer electronics) that need longer to get from the World’s production centers to the markets is also a cost.
On top, shipping lines are demanding ever shorter port stays in order to make the economies of scale work. The bigger the ship, the greater the cost of hours lost in port, and an increased port stay is a diseconomy of scale (Cullinane, 1999). Therefore, shipping lines either need to reduce the number of port calls – and as such make more use of transshipment hubs, also a factor adding to the overall cost of transportation – or they need to get handled faster (increasing berth productivity). In principle, they would keep the time in port the same, however with an increase in exchange size. It is this requirement that we will explore further in this article. What are the costs of increasing vessel size for the terminal operator, especially in a stabilized market, such as Europe or the United States? We focus on these markets, as there the like for like situation can be seen quite clearly. In emerging markets, the cost increase that may be suspected is typically covered by the increase in port size and volume that is happening, and as such it is not posing such a big dilemma for terminal operators.
However, in stable markets the question is quite clear: who pays the bill of the upgrades needed to (1) facilitate the larger vessels, and (2) who pays the bill to handle them in shorter periods of time, whilst the volume exchanged per call increases?
Although this question seems only relevant for the ports handling the biggest vessels, the same dilemma comes up for regional ports. As the larger vessels visit the biggest ports, the cascading effect causes the former biggest vessels to call the regional ports. They may just as well be lacking capacity to handling ships in the range of 5,000 – 8,000 TEU as big terminals are not able to handle vessels of 12,000 TEU and upwards.
Impact on terminals
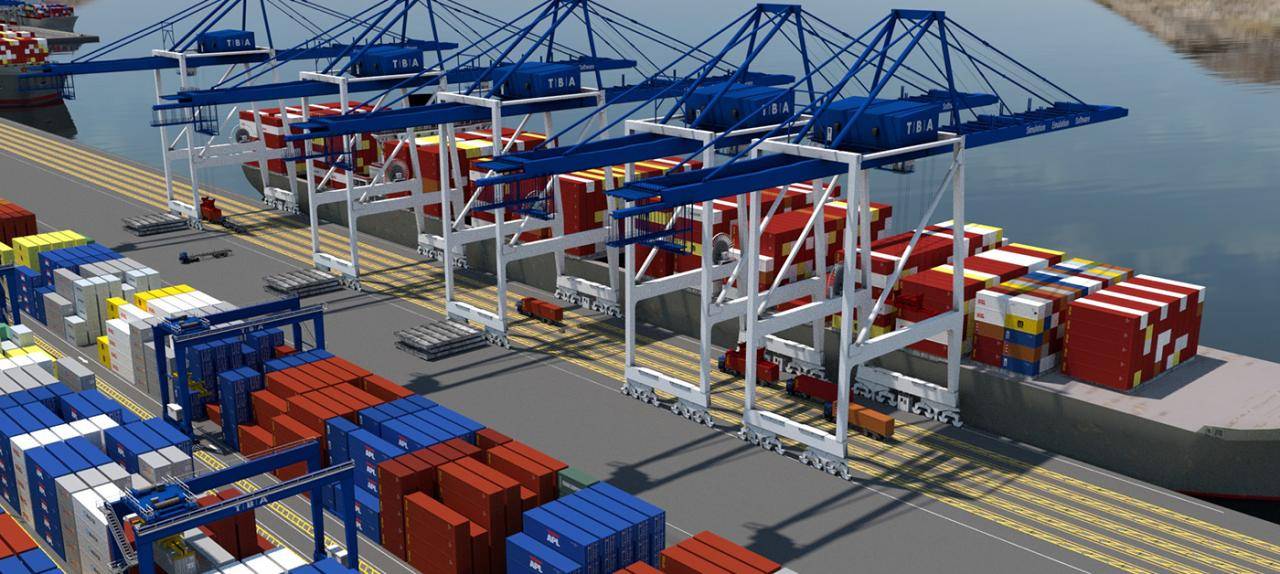
So what are these consequences for terminals? The most obvious ones are clearly the design and capability of the quay (draught, strength) and the quay cranes (outreach, airdraft). Less obvious are the effects for the yard, and the yard handling equipment. In order to illustrate these effects, we have created an example. In this example features a fictious 600,000 TEU terminal (see also Saanen & Rijsenbrij, 2012), predominantly handling local cargo (i.e. a gateway terminal). The terminal is equipped with a quay wall of 600m (at the time it was planned a 2 berth facility), and 4 quay cranes.
We analyse this terminal under 4 different scenarios, each with a different average ship size. The ships call size (number of containers handled per visit) is directly linked to the ship’s size.

Table 1: Vessel increase at equal volumes
We assume that the port stay has to remain equal to maximize the economies of scale for the shipping line. This results in the following (see Table 2) required berth productivities, and crane densities. Here we have assumed (based on experience) that initially, the larger vessels improve crane productivity, but at some point reduce crane productivity again, as the cycle times become longer and longer, diminishing the effect of larger hatches in the vessel, and therefore lesser crane gantry movements. It clearly can be seen that the number of quay cranes required increases from 2 initially, to 7 for the largest ships. As the number of annual vessel visits decreases, the number of cranes required ‘only’ increases from 4 initially to 7 (see Table 3). In the first scenario, it is likely that there are 2 vessels simultaneously, where in the fourth scenario, there is only a ship every 3 – 4 days. This is also reflected in the diminishing berth utilisation, dropping from a fine 55% down to 18%. The latter can be seen as poor resource utilisation, or as commercial opportunity for attracting new business. This under the condition that the yard and gate can handle an increase in volume. Already, with an increase in call size per vessel, it can be expected that a large percentage of the containers are brought to and collected from the terminal inbetween 2 days before vessel arrival and the 2 days after vessel departure, increasing yard and gate peak loads.

Table 2: Assumed & required productivity levels and crane density

Table 3: Number of calls and number of cranes
Impact on financials
How does this increased berth productivity and increased deployment of capital intensive equipment work out on the operational costs? For this purpose, we modelled the demand and equipment productivities (see Table 4). As we can see, to support the higher berth productivity, additional equipment is needed, from 19 RTG’s in scenario 1 to 32 in scenario 4. We assumed that the equipment productivity of terminal truck (TT) and RTG would stay at the same level.
An upside of the increasing QC productivity we see in the QC running hours, reducing in line with the increasing productivity from scenario 1 à 3, and then increasing again in scenario 4.

Table 4: Equipment numbers and running hours
When we then look at the impact on operational costs (including depreciation) for waterside and yard – assuming that no additional land or gate infrastructure is required – we can see that the change from the scenario with 4,000 TEU vessels to 18,000 TEU vessels increases operational cost by 17%. On top, it is that the equipment needs to be upgraded, and the fleet of yard equipment needs to be expanded. Easily, an investment in the range of 53M USD (in case the QC’s were already capable of handling the 18,000 TEU vessels) to 75M USD (in case all QC’s would need to be replaced with larger ones. Under the premise of increasing operating costs, this CAPEX does not have a ROI, unless the freed up berth capacity can be used, and additional yard and gate capacity can be realized!

Figure 1: Resulting operational costs
Conclusions
So what can we conclude from this analysis? First, that larger vessels are maybe the right way to go for the lines, but they are not for the terminals. In order to keep the operational costs at the same levels, the rates need to increase by 3 – 17% depending on the increase in vessel size.
In the current climate not a message that would be appreciated by the lines, who are coping with over capacity, and therefore are using their ultra large vessels in regular services calling more ports than originally anticipated. As such, the importance of fast handling becomes even larger.
Lines and terminals have to come to terms in this matter, only than the savings on liner side can be turned into productivity improvements at terminals.
This article has been published in Port Technology July 2013
Literature
- Cullinane, K and Khanna, M (2000). "Economies of Scale in Large Containerships", Journal of Transport Economics and Policy, Vol. 33, pp. 185-207.
- Dijkstra, A (2008). Trade-off between handling and hauling speed in liner shipping with increasing cargo volumes, Msc thesis, Groningen, The Netherlands, Rijks Universiteit Groningen.
- Notteboom, T (2004). Container Shipping and Ports: An Overview. Review of Network Economics, 3, pp 86-106.
- Saanen, Y A and Rijsenbrij, J C (2012). Design of the Systems and operations in Container Terminals, MEL 2012, course syllabus, Rotterdam, The Netherlands.
- Streng, M. (2012). Slow steaming: an economic assessment of lowering sailing speeds on a supply chain level, Master Thesis Urban, Port and Transport Economics, Erasmus University Rotterdam.
- Wright, R (2011). Big Ships: Container lines reach for scale, Financial times.
Share this
Using emulation to improve the performance of your TOS

TBA partners with Awake.AI to bring AI-powered vessel ETA times to CommTrac