Optimisation as mantra for operational excellence
Experience with process improvement
To most, TBA is known for its services during terminal planning and realisation, state-of-the-art simulation models to quantify the need of future operations. Following this approach, TBA has worked on many new terminals that meanwhile have gone into live operation – e.g. Euromax, Khalifa Port, Antwerp and London Gateway, APMT Virginia, DP World Brisbane, BNCT in Pusan, GTI in Mumbai, Transnet in Durban, Tercat in Barcelona, GCT in New York, LBCT in Long Beach, APMT MV2 in Rotterdam, and Rotterdam World Gateway.
Probably, TBA is less known for its support of operational improvement, optimising the terminal's processes. Over the course of the last 10 years, TBA has looked at over 30 terminals, and applied its proven process improvement approach, based on the DMAIC or 6-sigma model. In this paper we discuss the approach and its results, arguing that every terminal should do it, one way or the other. The business case – as we will show in this paper – for process improvement at container terminals is very solid, meaning returns within 1 year.
Objectives
Most terminals strive for higher waterside performance (quay crane or berth productivity). The easiest way to achieve this is to deploy more equipment (yard equipment and horizontal transportation equipment). However, this typically leads to an increase in operating costs, which is not in the interest of the terminal, unless the shipping line is willing to pay more for shorter turn times in port (which is rarely the case). Hence, adding equipment is not the way to go. It also means that just measuring service levels (berth productivity, or truck turn time), is sufficient to determine whether the terminal has improved its efficiency.
To overcome this, we introduce the performance-cost index (PCI), which looks at the change (ΔP) in performance in relation to the change in operating expenses (ΔC). In formula form:

As example:

The PCI would then turn out as: (1 + (27–25)/25)/(1 + (145-150)/150) = 1.08 / 0.97 = 1.12 (12% improvement).
Similarly, other performance KPI's could be integrated in the P formula, weighted against their relative importance, in the form of:
![]()
where a is the relative weight of a KPI, and P the performance of that KPI.
The approach
The approach we have developed is divided into three main phases (see also Figure 1):
- Quick scan
- Improvement study
- Implementation & Continuous improvement

Figure 1: Process improvement approach
Quick scan
The objective of this phase is to arrive at a diagnosis of the operation and to have insight into bottlenecks and opportunities. This quick scan consists of 4 steps: data analysis, layout review, site visit, and reporting. During the on-site visit, the results from the initial data analysis are discussed, which typically leads to observations the terminal staff was not entirely aware of. This range from the frequency of QC deployment, the distances driven by prime movers, the time equipment is idle, etcetera. Subsequently, several brainstorming sessions are held, followed by time and motion studies and staff interviews.
The data analysis will commence prior to the initial site visit and focuses on:
- Container flow data, equipment characteristics, vessel patterns (pro forma berth schedule), and layout characteristics.
- Recent and past utilisation and productivity of equipment, using TBA’s KPI tool to analyze TOS data.
- Layout analysis.
- Capacity analysis of berth and yard.
The final result of the quick scan phase is a list of identified bottlenecks, as well as a list with potential improvements. The latter list will be divided into 3 categories:
- Measures to implement immediately, without further study (internal or external)
- Measures to analyse using simulation in the coming period
- Measures to be put on hold until further notice
The operational aspects that are typically covered in the list of improvement measures:
- Terminal capacity
- Key performance indicators
- Terminal layout, possibly of off-dock sites
- Operating procedures and processes (including planning and use of information) Yard strategy
- Equipment characteristics and productivity
- Time and motion in the operation
- Container and traffic flow
- Resource deployment

Figure 2: Areas of attention for improvement measures
Observations and performance numbers are compared to with peer sites and benchmarks for similar terminals, and applicable best practices. From this list of references, a list of identified bottlenecks, as well as possible improvement measures will be created.
At the end of the on-site visit, the draft quick scan report will be presented; the final version is typically finalised within a week after the site visit. The report will include a list of improvement measures which will be roughly evaluated on expected effort and gain, and graphically displayed in an improvement matrix based on experience as shown in Figure 3. In this initial study, no quantified tools will be used to evaluate the measures. We will rank them based on experience into the 3 categories aforementioned. Here our Improvement Matrix helps to categorise the benefits versus the costs of each measure. We distinguish 4 categories:
- Cash cows (high benefit, low implementation cost)
- Stars (high benefit, high implementation cost)
- Question marks (low benefit, low implementation cost)
- Dogs (low benefit, high implementation cost)

Figure 3: TBA’s Improvement Matrix to Graphically Rank Performance Measures
Improvement study
The improvement study is the next step in the improvement approach, and takes the list with identified improvement measures to an in-depth analysis, to determine the impacts on performance and cost such measures would have.
The aim of this step is to arrive at a list of evaluated improvement measures and an implementation plan. This phase will immediately commence, and the lead developer will be part of the team on-site, so he is involved from the beginning to ensure fast and accurate modeling. We discern three steps:
- Develop and validate a model of the terminal, and model the improvement measures as alternative solutions.
- Analyse in detail the impact of the improvement measures on performance and cost.
- Define an implementation plan based on the outcome.
The most promising improvement measures that require additional study will be developed further and analysed in more detail. Jointly a list of improvement measures will be determined that needs detailed, quantitative investigation – this to avoid that the wrong strategies are implemented. Impact on both costs and performance will be analysed in more detail to update the graphical representation.
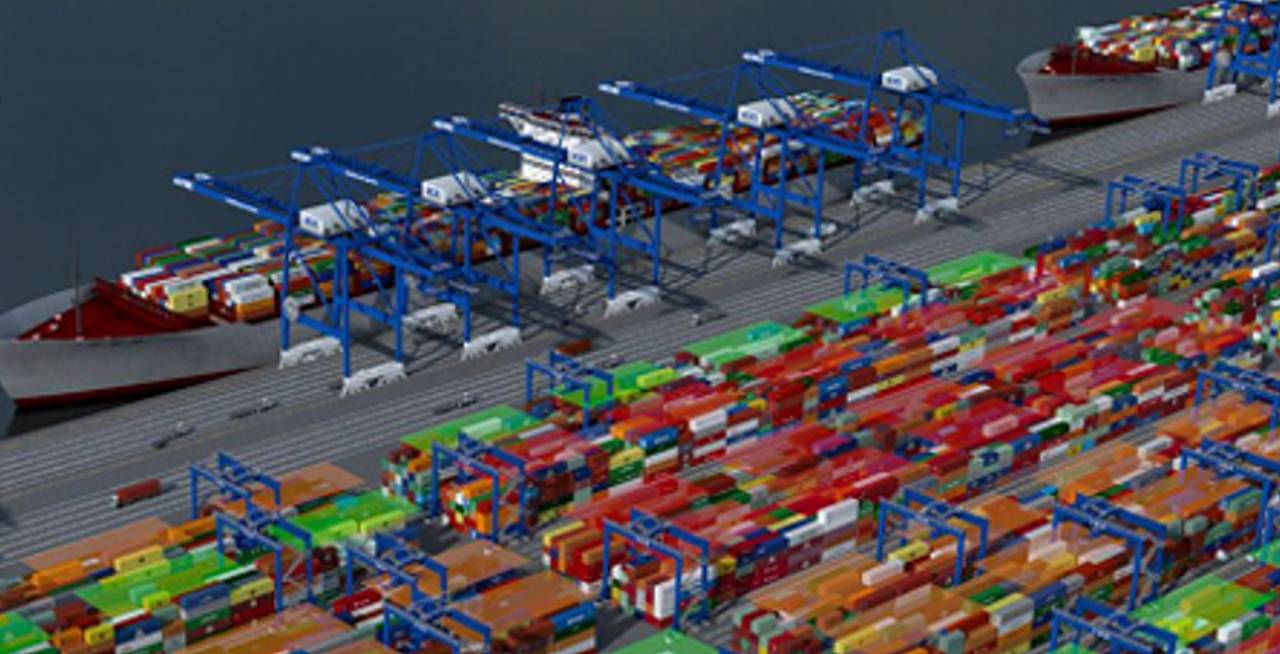
For the evaluation of the impact of the improvement measures on terminal performance, we will make use of advanced models (TIMESQUARE) that are validated using real data from the terminal. These models can be used to determine the best improvement measures, and to quantify them for performance impact and operational cost impact. In Figure 4, a typical example of results from an analysis of improvement is tabled. The potential monthly (!) savings are exemplary for exercises like this.

Figure 4: Example of results from a simulation, including PCI calculation
The modelling and validation part is the most time-consuming tasks. Although we have an extensive in-house library of terminal models – ranging from simple reach stacker models, to large scale automated terminals – the calibration to a specific terminal’s environment, with specific (labour) practices and processes takes time and diligence. It pays off though because a validated model is a perfect playground to investigate the various ideas that live at a terminal.

Figure 5: Snapshots from TBA's TIMESQUARE simulation model
In addition to performance analyses, the impact on cost (investment and operational cost) of the improvement measures will be analysed for labour hours, equipment running hours, equipment maintenance, equipment energy consumption, and equipment purchase.
The results of the performance and cost analyses are combined in the performance cost index. See Figure 6 for an example where packages of improvement measures are combined.

Figure 6: Comparison of Improvement Measures vs. Performance Cost Index and Required CAPEX
In a joint session, the terminal and TBA will select the improvements that should be implemented.
Implementation
The hardest part is the implementation. After reaching a list of promising (and less promising improvements), the changes have to be implemented, and this requires change management. Typically, there is remaining resistance against change, although having the numbers in hand, it helps to convince people that this is the right way forward. Based on our experience, the following is key during the implementation:
- Only implement one improvement measure at the time; as such you allow for focus and measurement of the result.
- Ensure buy-in and understanding of all stakeholders involved; typically operations, IT, engineering, and the management.
- Do not give up after one trial; some changes require training, and practice.
- Ensure training beforehand; many changes fail due to a lack of training.
- Share success with all stakeholders.
- Check after a few months whether the new practice is still in place. Old habits are persistent.
Concluding remarks
As may have become clear from this paper: process improvement is a rewarding activity at container terminals. Therefore, it isn’t surprising that several global terminal operators have created there in-house lean 6-sigma teams. The returns of a successful implementation of improvement measures are large, and pay off in most cases within 1 year. The crucial point is the implementation (change) of the new practices, overcoming the resistance, and sticking to the new practices. In our experience, this has proved to be the hardest part. Nothing more difficult than change!
The quantitative approach we follow, using proven, accurate models that reflect operational practices to great detail helps to convince people, and assist in defining which measures are worthwhile to implement, and which are better to stay untouched, just wasting resources. Moreover, bringing international benchmarks also helps placing practices in its context. As much as terminals think they are different, as much as operational practices prove to be applicable world-wide.
This paper was previously published in Port Technology International magazine in 2014 and its contents has been slightly updated to reflect current date.
Share this
You May Also Like
These Related Stories

Lean and mean terminal design benefits from advanced modelling

Analysing the stockyard: one of the basic elements of a dry bulk terminal
