Applying new technologies in an existing automated terminal
TBA’s vision is to improve the cost efficiency and productivity of container and bulk terminals worldwide through consultancy and software. We distinguish ourselves by state-of-the-art tools such as simulation and emulation. Our clients include all major container terminal operators worldwide and many local port operators. We have designed several automated container terminals worldwide from layout design, to performance testing by simulation, and to live operations with delivery of software for the robotized machines. As such we have experienced that automated terminals perform very well in a simulated environment, but often perform not so good, when actually going live. This article focuses on improvement measures for automated terminals.
Introduction
In the world of container terminals, there is a conception that fully automated, or robotized, container terminals are performing at low productivity. How can it be that in the simulated world, the designed and tested automated terminals perform very well (above 35 moves per hour under peak circumstances), and not in real life? This question we have asked ourselves, also to critically review our simulation models.
In order to do so, we started from one of the existing state-of-the-art fully automated facilities and added the latest improvements to the model to see whether the performance could be increased. We used TBA’s own proven container terminal simulation suite to quantify the effects of each adjustment individually.
In this article, we describe this step-wise improvement approach from an imaginary existing terminal with Dual RMGs and AGVs, as would have been constructed around the year 2000. For each step towards a state-of-the-art terminal with Twin-RMGs and Lift-AGVs we show the effect on productivity. We start by briefly describing the different equipment types.
RMGs are Rail-Mounted Gantries that are installed on a stack module, the area where containers are stored and exchanged between ships, trucks and trains. Containers from the ships enter the stack module from one side. They are stored for several days in the stack, after which they are delivered to a truck that picks up the container on the other side.
Of course, this process can also be supported in reverse order (truck → stack → ship); or containers that were delivered by a ship, are later loaded onto another ship, called transhipment. Dual RMGs are RMGs that can pass each other because one is larger than the other. Both RMGs are able to work on both ends. Twin RMGs are equally large and cannot pass each other. Each is dedicated to serving one end of the stack module. These cranes require less space than dual RMGs, since they share the same rail track and they are faster. However, they have less flexibility in job selection.
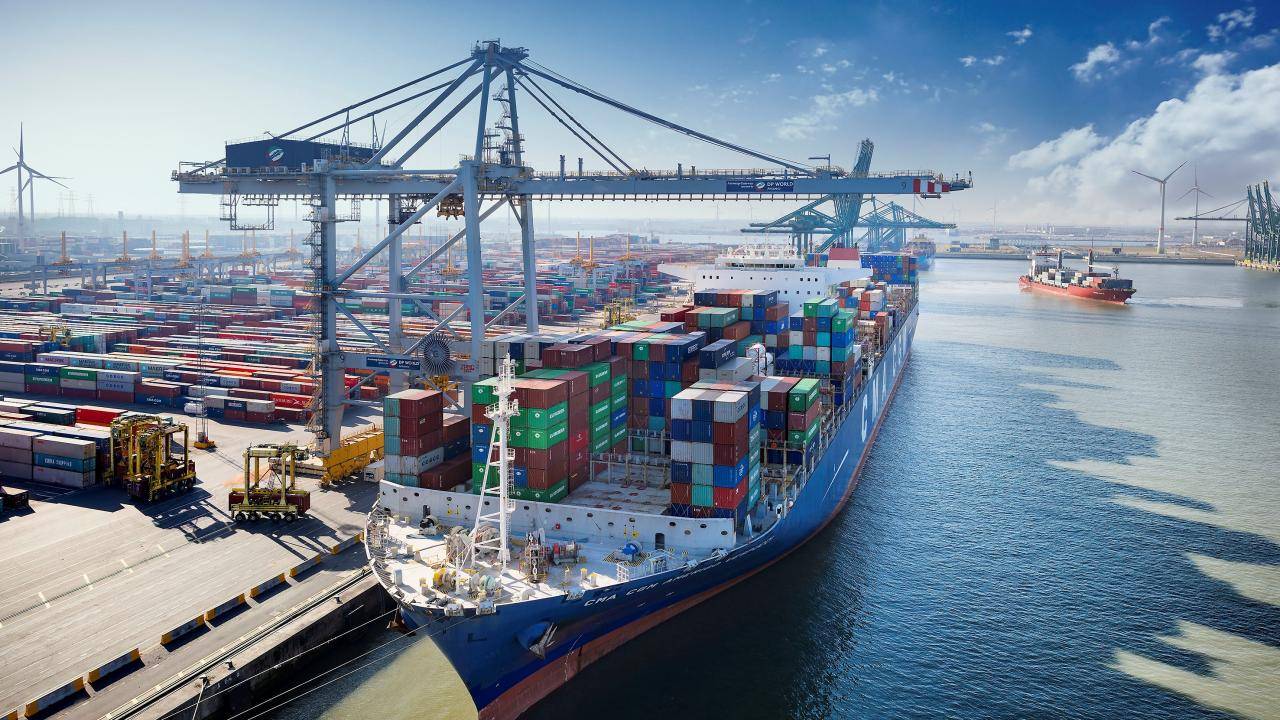
AGVs are Automated Guided Vehicles, robotized machines that carry containers and transport them between ships and stack. The AGVs of the start situation cannot take or drop containers. They wait under a quay crane at the ships, or an RMG in the stack until a container is lifted off, or dropped onto them. Lift-AGVs have a platform that can lift, and are able to take or drop containers at so-called racks. This makes them less reliable on other equipment since they do not need to wait until a crane can serve them directly. They can deliver a container at the rack, and an RMG will take the container when it has time to do so. The RMG can also drop containers at the rack a few minutes before a Lift-AGV needs to pick it up. Racks are only installed at stack modules. The start terminal is suitable to handle approx. 1.3 million containers per year, with 16 double trolley Quay Cranes on 1,500m quay, and a landside peak of 320 containers per hour (this is how many containers are delivered and taken by road trucks in the busiest hours). The yard consists of 35 stack modules with dual RMGs. The containers in the stack can be stored on piles of 4 containers high. Waterside transport is done by AGVs.
This investigation focuses on average quay crane productivity that can be achieved in peak hours. The simulation results of all steps including the start situation are shown in Figure 2. The different steps are represented in the “improvement tree” shown in Figure 1.

Step 1: Replace dual RMGs with twin RMGs
Twin RMGs cannot pass each other but have a higher gantry speed (4.0 m/s instead of 3.5 m/s). Furthermore, the width of a 10 wide twin-RMG is less than for a cross-over RMG, hence in the same footprint 6 additional stacks can be realized: +19% storage capacity.
Results
The increase in quay crane performance equals 0.5 to 1.5 bx/hr, a quite limited result. The truck service times drastically decrease when we use twin-RMGs, with one RMG dedicated to the landside. Trucks are processed 6 minutes faster on average in the “Step 1” scenario with twin RMGs.
Step 2: Increasing terminal throughput
In step 1 we already saw an increase in storage capacity. In this step, we also increased the maximum stacking height from 4 to 5. The overall throughput increase equals 119% * 125% = 48%. This means that the yearly throughput can be 1.9 million containers. The twin-RMGs should be able to process a larger volume because they are faster (4 m/s instead of 3.5 m/s) and there are more cranes (six extra modules: 82 instead of 70 RMGs). The peak landside volume increases to 470 boxes per hour. If the 16 quay cranes should be able to achieve 48% higher peak throughput as well, the cranes must perform 40 to 42 bx/hr.
Results
The impact of a higher stack and higher volume can mainly be observed on the landside: the RMGs have to do more digging for containers, and hence the service time of trucks increases. The required peak volume can be processed through.
Step 3: Replacing AGVs by Lift-AGVs
AGVs require a “hand-shake” interchange with RMGs at the yard. This causes waiting times for both RMGs and AGVs because for almost every move one of them has to wait for the other to arrive. This handshake can be excluded from the process by using Lift- AGVs instead of AGVs. In this step we use Lift-AGVs with – besides the lifting ability – the same specs as the (10 years old) AGVs. The racks require more space than interchange positions that are used for AGVs, hence the total number of interchange slots at the stack is reduced. Lift-AGVs need time to lift and lower their platform, which requires additional handling time.
Results
The quay crane performance increases by 3 to 3.5 bx/hr for any number of vehicles per crane. The reduced waiting times largely outweigh the longer handling times and fewer transfer points. The impact can be seen in the time per container move of the Lift-AGV versus AGV. Whereas AGVs stand still at the stack interchange for 2.6 minutes per cycle (waiting for RMG and the actual placement or removal of the container), Lift-AGVs only spend 0.3 minutes per container at the rack, reducing the total handling time of one container from more than 11, to 10 minutes.
Step 4: Using state-of-the-art Lift-AGVs
In the previous step, we used year-2000 AGV technical specs for the Lift-AGVs. Now we increase the driving speeds according to the latest standards, meaning increasing top speeds and acceleration values. The new Lift-AGVs can drive faster straight, faster in curves, and accelerate faster. This should cause shorter driving times per box, and hence increased QC productivity.
Results
The quay crane productivity increases significantly again: with 4 to 5 bx/hr. The quay crane productivity increase is caused by the huge reduction in Lift-AGV driving times per box: from 6.5 to 5 minutes. The Lift-AGVs generally arrive at the quay cranes earlier. Occasionally they have to wait before they can be served at the quay cranes now because they are too early.
Step 5A: More opportunity moves
Glossary: handling opportunity moves is the handling of multiple containers in one order. E.g. two 20ft containers can be transported by one Lift- AGV because the platform is large enough for 45ft, and the quay crane can also lift two 20ft containers off the Lift-AGV. This is called twin-lift.
In the original situation, it was not beneficial to handle more than 10% of the containers with twin-lift moves at the quay cranes because of yard handling limitations. After step 4, both the waterside and the landside RMG in the stack modules have idle time. To make use of this spare time, we increased the twin-lift percentage at the quay cranes to 30%. We assume most 20ft containers could be twin-lifted when planned right.
The quay cranes can now handle more containers per cycle (per move). If the container supply can be increased the productivity will go up. The RMGs need to supply more containers faster, and the Lift- AGVs should transport and deliver them more just-in-time.
Results
The quay crane productivity is increased by about 3 bx/hr. The quay crane performance increase is only possible because the RMGs were able to supply more containers to the interchange racks (and take more containers from them). Each stack module was able to process one additional vessel job per hour. The increase in productive moves causes the time spent on productive moves to go up from 62% to 66%. The idle percentage decreased from 19% to 16%. The remaining idle time indicates there is still room for improvement.
Step 5B: Faster quay cranes (and NO increased twin percentage)
The (1990-2000) quay cranes in the original scenario that have been used up to now, are relatively slow. The landside hoist has an average cycle time of 99 seconds. With modern cranes, cycle times of 63 seconds should be possible. The kinematics of the cranes in the model have been adjusted in step 5B to be able to make cycles of 63 seconds.
Results
The quay crane productivity increases by 5 to 7 bx/ hr.
Step 6: All adjustments combined
The final step is a comparison between the start scenario and all adjustments described in the previous steps. We will see the overall impact on performance levels.
Quay crane productivity has increased by 17.2 bx/hr in the experiments with 5 vehicles per QC, or 68%! Remember that in step 2, with the increased throughput, we already stated that QC productivity needed to go up to between 40 and 42 bx/hr and this goal has been achieved.
The increased quay crane productivity is only possible with more efficient Lift-AGVs and RMGs. The lift-AGVs in the final scenario only need 7 minutes to complete one container move, while originally the AGVs needed over 11 minutes.
With the increased waterside productivities, the stress on the yard has increased as well. The terminal throughput and according to gate volume cause additional moves in the yard. The gate report shows that the RMGs are able to cope with this increased demand because 460 truck moves have been handled and the truck service times are still acceptable.
The increased demand on the yard is supported by the two RMGs in each stack module, which together handle 18 vessel boxes and 12 gate boxes per hour, about 50% more than the original scenario.

Conclusions
In this article, we described a step-by-step approach to improve large automated terminals to state-of-the-art terminals and what each step can bring. Besides faster truck and vessel handling, the described adjustments lead to a throughput increase of almost 50%.
Adjusting existing terminals with the described changes is a costly and time-consuming operation; this may be a bridge too far. However, this study shows how important it can be to build new terminals according to the latest technology, because the performance is highly dependent on this.
Furthermore, the study proves that although the results of simulations seem to be too high compared to current experience, the steps from today’s state-of-the-art – which can be validly represented in the same type of simulation model – to the future’s state-of-the-art are concise and largely doable. This provides a solid and prosperous outlook for tomorrow’s fully automated terminals!
This article has been published in Sector Magazine
Share this
You May Also Like
These Related Stories

Human Machine Interfaces - the key to productivity?

Terminal Automation: Key Questions Answered
