Introduction:
The enclosed is a proposed approach to supporting environmental planning documents for container and intermodal terminals. This approach includes a detailed analytical support for emissions studies, using simulation models. These models provide an accurate representation of air and noise emissions, consumption of energy, not only by location of operating hours, but also emissions for high acceleration and idling areas. The models also allow for the evaluation of energy saving technologies, such as energy regeneration and start-stop systems on engines. We provide sample results for a representative terminal.
The current port development situation requires detailed logic and supporting analysis for expected energy and air emissions impacts of new projects. This article defines a process for using advanced simulation model output to support a container terminal planning process. Representative graphics are enclosed for visual support.
Results from an analysis of this kind provide the following benefits:
- Understanding of energy and environmental impacts of container terminal alternatives
- Differences between operating modes and strategies
- Support for permitting efforts, showing relative environmental benefits of the proposed actions
- Support for board presentations to show that a given project is “green”, or reduces energy use
One result of the output is the ability to provide data on point-source emission within a facility. This is in contrast to data that is aggregated for a whole facility or region. See Figure 1. This result is intuitively interesting, and supports an increased level of study where concern for proximity of employees to emission sources is relevant. This proximity has now become an issue at Southern California ports, since the California Air Resources Board (ARB) declared diesel particulate matter (PM) a toxic air contaminant.
“Diesel engines emit a complex mixture of air pollutants, composed of gaseous and solid material. The visible emissions in diesel exhaust are known as particulate matter or PM, which includes carbon particles or "soot.” In 1998, ARB identified diesel PM as a toxic air contaminant based on its potential to cause cancer, premature deaths, and other health problems. Health risks from diesel PM are highest in areas of concentrated emissions, such as near ports, rail yards, freeways, or warehouse distribution centers. Exposure to diesel PM is a health hazard, particularly to children whose lungs are still developing and the elderly who may have other serious health problems.”
Besides PM, diesel emissions include the following potentially harmful pollutants: Nitrogen Oxides (NOx), Sulfur Oxides (SOx), Carbon Dioxide (CO2), and Hydrocarbons (HC). In excessive quantities, each of these can have harmful health effects. This paper will not expound on the pollutants, but will focus on how to study the engines and site options. These results can then feed into an evaluation of pollutant levels that also considers the engine and fuel type, and local sensitivity and limits. It is the focus of many ports to reduce diesel exhaust and other potentially negative effects of terminal operations. The following presents a way to extend the study of future port alternatives (renovation or new-build) to the relative environmental impacts of the options.
Experiment setup
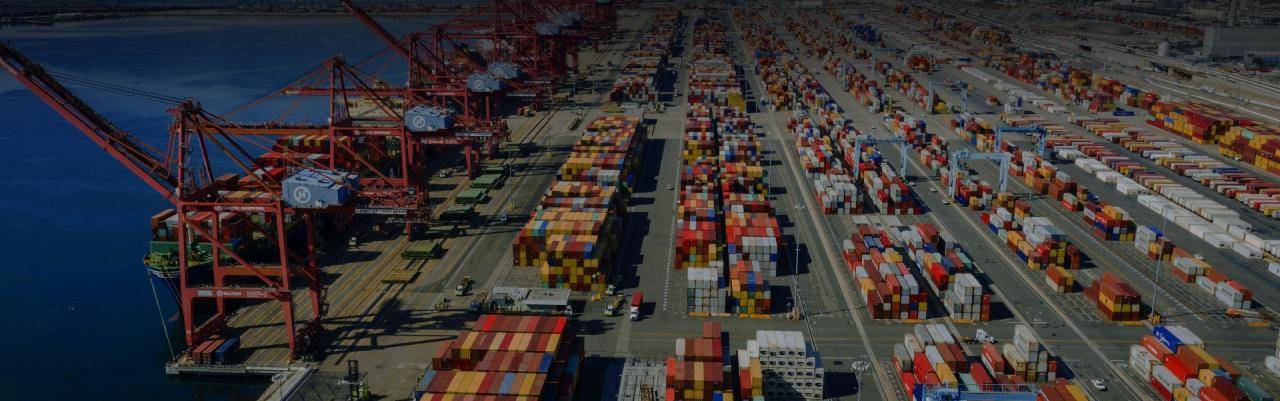
We demonstrate the application of simulation models in energy consumption and pollution investigations for a fictitious container terminal. In our detailed simulation tool TIMESQUARE, we have built a typical rubber tired gantry crane (RTG) terminal designed for 700,000 TEU / yr throughput, with six ship-to-shore (STS) cranes and 26 RTGs. Quay cranes are served with five dedicated Terminal Trucks (TT) each. We assume TTs and street trucks will drive a maximum 30 km/h (8.4 m/s) on the terminal.
The terminal consists of 24 RTG storage blocks, separated into a dedicated export/transshipment area and a dedicated import area. A separate empty stack area is operated by empty handlers. The terminal in this experiment is considered to have a transshipment ratio of 20%, and an equal distribution of load and discharge moves at the quay. 85% of the containers are non-reefer loads, 12% empty and 3% reefers. No special containers are considered in this example. The graphic imagery in Figures 1 and 2 are based on a peak scenario, where all six quay cranes are in operation for two vessels, and 80 trucks arrive at the terminal through the gate.
Emission Animation
With the simulation model, we are able to measure a variety of data for each piece of equipment that is present on the terminal. In this case we measure energy use, fuel consumption, and emissions of CO2, CO, NOx and HC; all of these are configurable parameters in our model and are dependent on machine velocity, cargo weight, and acceleration / deceleration. We measure consumption and emissions every second, based on assumptions made for our fictitious terminal. In the case of a real terminal, we would typically consult experts from the terminal and equipment manufacturer to use accurate engine and fuel-dependent emission levels. These can also be field-verified.
In addition to measuring consumption and emissions, we also register the location of the corresponding pieces of equipment. This enables us to create two types of pictures:
- Figure 1: Averages; in this case you can see a representation of the average CO2-emission during a four-hour peak period in all areas of the terminal
- Figure 2: Snapshot; shows the CO2-emission ratio (g/sec) of all pieces of equipment at a certain moment in time.

Figure 1: “Heat-map” representation of average CO2-emissions over time in a sample RTG terminal. The hot spots indicate the areas with the highest emission levels. These occur around the vessels, and dense road crossings where many vehicles pass and a lot of braking and acceleration takes place. Wind is disregarded.

Figure 2: Snapshot of modeled CO2-emissions. This shows for a moment in time the locations and relative emissions of all engines.
To obtain more insight in vehicle emissions under different circumstances, we have created a data-logging utility that can be used, for example, to document vehicle emissions vs. driving speed. Figure 3 shows that a TT emits most gasses when accelerating, especially when doing so with a heavy container (this is the case on the right side of the graph). Emissions are shown at this micro level in grams per second. However, based on these raw data, long-term assessments can be made quantifying the “environmental footprint” of a terminal.

Figure 2: Example of emulation running in 2D mode.
Performance indicators for assessing the performance of the TOS
Typically, a TOS does not generate detailed statistics with regard to the equipment. However, the emulation tool will generate detailed statistics that go beyond QC productivity and truck turn around time. These statistics will enable much more detailed analysis of the reasons for a certain productivity – for instance longer travel distances.

Figure 3: Emissions and driving speed of a terminal tractor over ten minutes.
Alternative Studies
This section describes the manner in which simulation can help with investigating the differences between terminal equipment types, operational strategies and equipment modifications.
Limitations:
We limit our investigations to provide focus on the large issue at hand. We focus on equipment alternatives and automation, providing supporting data on equipment type, hours and location. We do not investigate different air toxins that occur as a result of these hours, or the relative emissions between engine types. Results that indicate relative air emissions use a single representative value for emissions as a result of engine hours. We do not attempt to correlate expected emissions vs. empirical data. We do not describe all relevant pollutants, or adverse impacts.
Experiments:
Experiment 1: Equipment Alternatives. Use simulation to model differences in energy consumption and overall emissions for alternative operating modes, such as automated rail-mounted gantry (ARMG) cranes vs. RTG yard cranes.
Experiment 2. Operations Tuning. Study opportunities to make adjustments to an existing facility, and document the relative air and energy impacts.
We used TBA’s TIMESQUARE simulation modeling software, and made adjustments to investigate the issues at hand. In a typical planning project, the model will have already been prepared to study the other critical metrics for an operating mode decision. These metrics include expected productivity, equipment requirements for a balanced operation, capital and operating costs. If the model is already prepared, there is limited additional work required to support the environmental data collection.
Experiment 1 - Equipment Alternatives:
In this experiment, we compare model output for the typical RTG+TT terminal described above with a typical ARMG+AGV terminal designed for the same throughput of 700,000 TEU / yr. This type of study is valuable in supporting permitting documents for a project and for learning about the energy and environmental differences between operating mode alternatives.
A typical investigation like this will follow these steps:
- Data collection on terminal layout, equipment details (technical specs, operational behaviour, power consumption (with respect to weight, speed and acceleration), container flow, arrival patterns, strategies
- Building model, validation, calibration,
- Specify and run test scenarios
- Sample results by operating mode for alternative vehicles
Note that it is also possible to model noise zones within a terminal, resulting in a graphic similar to Figures A and B. We did not include this study for this experiment.
Results:
Figure 4 compares the total power consumption of an RTG+TT terminal vs. an ARMG+AGV terminal during a peak hour. Only waterside transporting vehicles (TT / AGV), yard cranes (RTG / RMG) and external street trucks are taken into consideration here. Although external truck power consumption does not influence operational cost of the terminal, it does influence the terminal emissions, and is therefore important to consider. Our fictitious ARMG+AGV terminal uses approximately 14% less energy in peaks. In addition, the quay crane productivity is higher than the RTG+TT terminal, which potentially reduces the vessel stay and associated ship emissions.

Figure 4: power consumption during peak hour on RTG+TT terminal and ARMG+AGV terminal
On a yearly basis, the difference between the terminal types is much larger than 14%. Because both vessels and trucks are served faster with RMGs (and AGVs) the operational hours of equipment go down. Figure 5 shows that the yearly power consumption in the RMG+AGV terminal we used in our example is 34% lower than the RTG+TT terminal.

Figure 5: yearly power consumption on RTG+TT terminal and ARMG+AGV terminal
The comparison between different terminal types is useful in many ways:
- Investment: investigate required equipment counts, and layout requirements.
- Design: develop and test strategies that can handle the desired workload and storage demands.
- Operational cost: Estimate annual operating hours of equipment, calculate power, fuel consumption, and man-hours etc.
- Environmental study: compare emissions and noise pollution on different terminals.
Experiment 2 - Operations Tuning.
In the following experiments, we investigate the opportunity to adjust operating strategies in order to reduce engine operating hours, and therefore emissions in an RTG/TT operation. Our method is to implement alternative strategies or technologies, e.g. regeneration of energy, and start-stop engines (these engines can stop when the equipment stops). This analysis could support the tuning of an existing or proposed facility.
Improvement alternatives on RTG-TT terminal
The following is a summary of the relative impact of a variety of initiatives as applied to an RTG terminal. Summary results are provided in Figure 6. The following alternatives were studied:
- Standard RTG terminal with traditional operation and planning rules.
- Increased quay productivity by different deployment of RTGs and TTs:
- Deploying more RTGs: instead of 26 RTGs we deploy 30 RTGs in the peak, and similar increase outside peak situations. Having more RTGs increases quay crane productivity and reduces truck service times, so terminal equipment has to be deployed in shorter periods of time. But when equipment needs to be deployed this is done in greater numbers, hence requiring more energy at that time. Simulation shows the trade-off between the positive and negative effects.
- Deploying more TTs per quay crane: this causes higher power consumption emissions during vessel operations, but increased vessel productivity will cause shorter service times, and hence shorter periods of high emissions, similar to deploying more RTGs.
- Replace RTGs by Eco-RTGs: Eco-RTGs have the ability to regenerate power when the hoist is lowering. Using Eco_RTGs will always reduce power consumption but are more expensive. We only show the energy savings here.
- Pooling of TTs: this has the potential to reduce driving distances and waiting times, which could reduce fuel consumption and emissions. A similar productivity can be achieved with fewer vehicles, or higher productivity with the same number of vehicles; both having a decreasing impact on energy and emission.
- Adjust TTs so that they shut engines down when practical (nowadays becoming popular in regular cars, but even more effective in terminal operations as in a large part of a TT’s cycle the vehicle is idling): The TT will not use fuel when shut down, but starting up more often will slightly increase fuel consumption and emission. The trade-off between these effects is measured.
Results of these experiments are presented in Figure 6, which shows the impact of each of the tests on annual power consumption. It shows that the most valuable measure is the use of Eco-RTGs - a fact confirmed by practice. Both pooling and use of start-stop TTs result in a smaller savings in power consumption. In our test scenario, the TT waiting times at the yard were relatively low, causing similarly low savings due to shutting down the engines. Start-stop engine benefits will be higher on terminals with longer RTG waiting times. Use of more equipment proved to have a negative effect in the test scenario. A change from 26 to 30 RTGS used more power, provided only a small increase in productivity, and did not significantly reduce handling times. Adding more equipment is more likely to be beneficial on terminals where availability of a certain type of equipment is a major bottleneck.

Figure 6: Annual power consumption of various alternatives for a sample RTG-TT terminal
Besides the modeled terminal adjustments, there are many other options to save on power and reduce emissions. Different yard handling strategies can be applied to reduce driving distances and hence reduce the use of transport equipment fuel. These include {handle transshipment closer to quay, store a relatively high density of 20-foot containers close to the quay, and stack containers with short dwell times closer to quay}. Yard strategies can be adjusted to reduce the number of unproductive moves in the yard, such as shuffles or housekeeping moves. This will reduce power consumption and may even reduce the quantity of required yard handling equipment.
General Measures
This section provides a summary of general measures to improve the environmental impact of a container terminal. Most of these measures are well-documented in the literature, and so they are only summarized here. Some alternatives are applicable to many operational options, and others are only applicable to some. The key is to develop an inventory of all applicable sources, and accurately model those with the greatest impact.
Measures applicable to vehicle engines: Exhaust emissions scrubbers, use of alternative fuels, utilize or convert diesel engines to electric or diesel-electric, target newer and cleaner engines for terminal vehicles, implement programs to improve street trucks through retrofit and buy-back programs, select yard operating modes that use fewer high-polluting diesel engines.
Measures applicable to vessels: Ships use less energy transporting goods than other forms of transit, but mainly because ships use a lower grade of fuel, the emissions of sulfur and nitrogen oxide are still proportionally higher. Measures include: Provide a dock-side power supply, facilitate a faster berthing process through technology (auto-mooring system) and/or best practices, enable less time at berth through higher productivity, improve/retrofit tugboat engines.
Truck Gate Emission Measures: Provide sufficient service lanes to avoid long queues at peak periods, automate processes when possible, provide fast service at pedestals, use an appointment system to reduce peak demand and long queues, provide longer gate hours to reduce peak demands.
Yard Equipment Measures: Convert from diesel-powered RTGs to electric RTGs or RMGs, ornext best use diesel-electric RTG engines, and systems that store energy as a load is lowered. For straddle carriers and shuttles, which are not available in electric models, it is preferred to use those with diesel-electric drives. Consider hybrid yard tractors. Electric AGVs are now being tested as an alternative to diesel-electric models. Convert remaining diesel ship to shore cranes to electric.
Railyard Measures: Use hybrid switching engines, choose electric RMG cranes over diesel RTGs, consider hybrid yard tractors, provide a buffer space under cranes to limit engine idling time, use on-dock rail yards when practical to limit drayage emissions.
Light Pollution Measures: Use down-lights with cut-off shields, consider automated stacking equipment, since in the fully automated areas these do not require lighting, reduce or eliminate directional floodlights.
Obstacles to Reducing Emissions: The biggest obstacle to lowering diesel emissions is the cost of implementing measures such as these. Competitive conditions can prevent an organization from choosing higher cost operations, and so the application of uniform regulations and controls is critical.
Automated terminals:
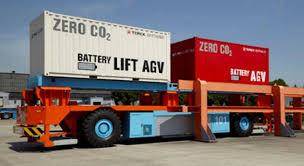
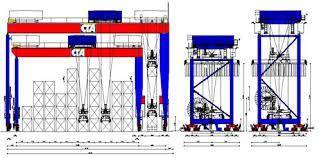
Electric RMGs are a popular component of modern container terminals. They have the advantages of traffic separation, low maintenance, are relatively straightforward to automate, and they have a “green” footprint since they have no (local) diesel emissions. A semi-automated terminal typically has drivers in the stevedoring equipment, and driverless yard cranes. A fully automated terminal also has driverless stevedoring vehicles. A new trend is to replace the hydraulic diesel-driven machines with diesel-electric or fully electric (battery powered) machines. Very soon, such experiments will be performed at HHLA’s automated terminal in Hamburg. However, automated terminals bring other environmental benefits, including:
- Reduced light, due to more limited areas requiring lighting
- Reduced noise, due to electric equipment and fewer warning alarms
- Opportunity to reduce rainwater runoff through ability to use open-graded level pavement
- Reduced air emissions, and greater separation of port workers from diesel exhaust
Summary Conclusions:
It is the focus of many ports to reduce diesel exhaust and other potentially negative effects of terminal operations. This article presented a method for the study of the environmental impact of future port alternatives. Simulation is a powerful tool to understand and seek to improve the environmental footprint of container terminals, including relative fuel consumption, diesel engine emissions, and noise pollution. We advocate for modeling the environmental effects of alternative potential improvements before implementation. The results then enable a balanced decision between options, and help to achieve the best possible return on investment in “green technology”.
Share this
Distributed E-services for road container transport simulation
Comparison of three automated stacking alternatives by means of simulation