The container industry is dynamic by nature. Due to considerable growth, the competitive situation in and between ports, and the changes in shipping line alliances of recent years, the container market has gained a certain dynamic. This is reflected at container terminals accommodating larger vessels, new combinations of shipping lines and often a step-wise growth. This growth could result in higher utilization of existing sites as well as regular expansion projects and new greenfield development for which simulation modelling can be of value.
As one can imagine, planning of new sites and places of expansion as
well as operations improvement is not that simple and requires answering several important questions about the layout, the attainable quay crane productivity, the yard operating strategy, the terminal operating system, and the equipment. We’ll try to show you that it all can be done in an efficient and reliable way.
The power of simulations
Although simulation is increasingly used in container terminals, it is not as common as for example in the automotive industry, where no significant investment is made without thorough proof by means of simulation. This is not strange at all when using a benchmark that for every Euro spent on simulation, ten are saved.
But what exactly is “simulation”? The essence of it is to make a model of the (future) reality within the scope of the study objectives. With this model all kinds of experiments can be performed. Usually, simulation is used to assess the effect of different alternatives, for instance, an operation with traddle carriers versus an operation with rubber-tyred gantry cranes (RTGs) and terminal trucks. However, as we will discuss further on, simulation can be applied for many more uses. In general, a simulation project exists of four steps:
First, specification and development of a model, second the validation of a model, then experimentation with a model, and finally analysis of the results. By means of the animation, which visualizes the behaviour of the system, people involved are able to look closer and validate the work of the system.
Model terminal operations
Some terminals are influenced by shipping alliances and may be under pressure to grow quickly. Therefore, a simulation can be a tool to help assess where bottlenecks could be expected – e.g. at the quay due to larger vessels, the yard due to storage constraints or in the yard or transport equipment to support the targeted service levels. It is very valuable to be able to analyse a what-if-scenario, using suitable tools to answer such questions.
Many terminals, for instance, are reconsidering their yard handling system to increase the stack density and therefore increase the throughput capacity of the terminal. As shipping lines are requesting higher service levels, terminal systems need to be designed striving for various – mostly contradictory – objectives. Quay crane productivity has to go up, stack density has to increase, operating costs have to go down, and the landside service has to be improved. In order to create handling systems that comply with those requirements, the use of a simulation approach can be beneficial to separate good from bad solutions and to prioritise improvement measures. Moreover, simulation provides an environment where one can evaluate under varying, but manageable, conditions, e.g. busy and quiet operations, breakdowns, and so forth. In the end, this will result in a more robust plan, solutions that are better thought through, increased software robustness, all leading to a reduction in risk. We aim to assess a solution within the overall system performance and include not only the technical capacity of a component, but also consider the unavoidable inefficiencies when considering a system comprised of several of those components. For instance we consider it much more realistic to consider the dynamics of 20 RMG blocks with twin cranes with its dynamics, than considering the capability of one block with twin cranes and multiply the result by 20. The overall system has inefficiencies that should be considered and therefore a system view is preferred.
The key to supporting these decisions by means of simulation is to model the equipment and operational procedures at a rather detailed level. Many attempts fail to link with reality, because the details that make an operation complicated – for instance the container loading sequence, the grounding rules, and the equipment assignment rules – are left away. We adhere an approach where those aspects are considered, so that the results from the simulation are similar to the operational data. Close cooperation between a modelling team and terminal operator to arrive at a valid model is essential here. The output of these kinds of models typically consists of productivity numbers of all the equipment (quay cranes, RTGs, and so on), service times (e.g. of hauliers and trains), occupancy rates of equipment, but also the utilization of the stack, and also the equipment’s operating hours.

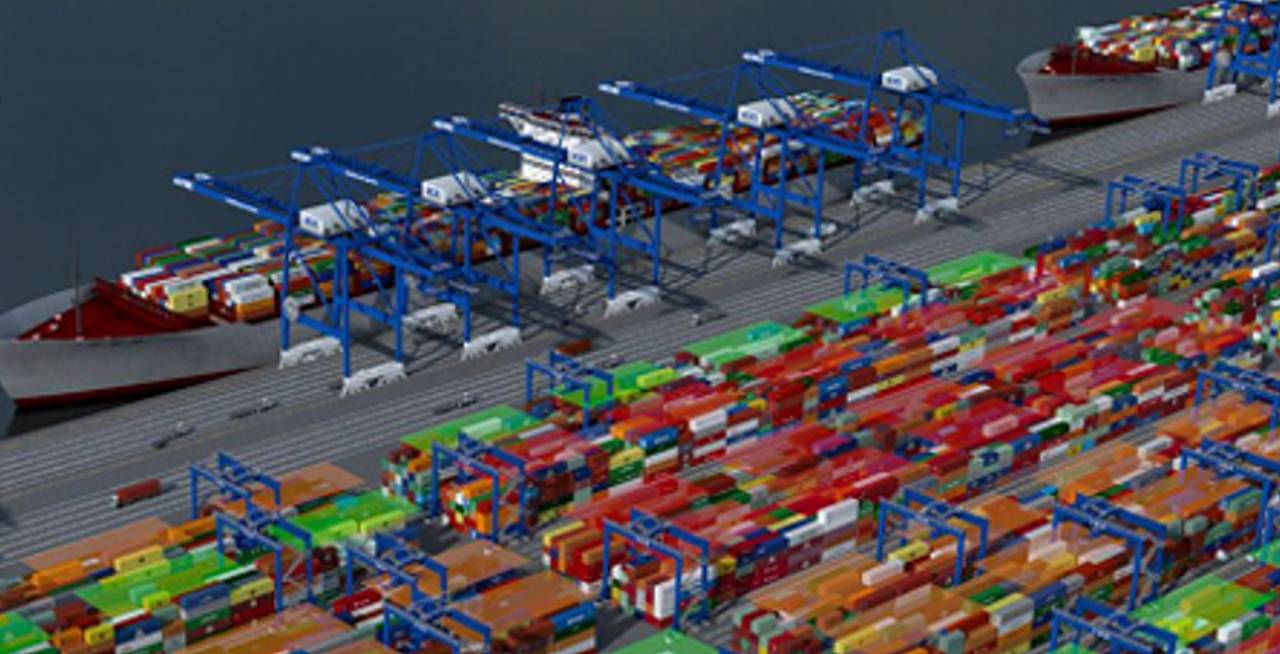
Figure 1: Screenshot from the simulation model to determine the key terminal parameters
Terminal planning of a greenfield site
The development of a new container terminal and the expansion of existing ones create new questions to be answered. Which layout, what kind of equipment and how many pieces of that equipment to purchase in order to have lower costs per move, an acceptable investment level, and competitive performance? These are typical questions awaiting a new container terminal’s development team. In the decision making process around these questions, simulation can play a supportive role regarding the dimensions of the terminal (e.g. quay length, stack size), the type of handling system (equipment, operation, and layout), and detailed specifications for equipment, layout and terminal operating system’s (TOS) functionality.
The first step is to determine the main requirements for the terminal. Here we apply an outside-in approach, taking the container flows that go through the terminal (vessel arrival pattern, rail pattern, truck pattern, dwell time) as a starting point. Under these external conditions, the main requirements are assessed. This means that we analyse the service level (vessel service time, gross berth productivities, and crane density on vessels) under varying terminal configurations (quay length, number of quay cranes, gross quay crane productivity). Typically, per configuration, one year of operation is simulated, creating a picture of the service over the year. During the year, the variation in the stack (seasonal effects, peaks during the peak and even hourly peaks due to large discharge calls), the variation in berth occupancy (due to vessel delays, and variation in the call size), and the occupation of quay cranes can be observed, giving a rich picture of the service the terminal provides.
For a robust design, several important parameters can be modified to obtain an even richer picture in the terminal planning. A variation in cargo mix, dwell times and vessel mix can be varied to understand the terminal’s requirements for varying circumstances. As important input for the next step (determination of the handling system), the model creates an understanding of the peaks in handling (waterside, but also rail-and truck-side). These peaks are important to determine how much equipment is required to supply the quay cranes with enough containers during these peak circumstances. Based on the outcome, decisions can be made concerning the quay length, the number of quay cranes, the gross productivity that quays have to achieve to accommodate a certain terminal throughput, the requirements for storage capacity, and the peak handling conditions.
The second step is more comprehensive, in the sense that there are many variables involved. Planning of the handling system involves the layout, type of equipment for the various operations – think of the number of trucks and RTGs, the number of rail cranes, the number of gate lanes, and so forth, and the logistical concept (incl. yard operating strategies). The latter is gaining importance in the case of automated terminals, since many tasks are taken over by computers. However, also at manually operated terminals is the emphasis put on efficient operations – for instance the implementation of truck or straddle carrier pooling. In this step, the TOS should be considered in close relation to the equipment as the TOS will make important decisions on grounding and dispatching and a realistic decision systematic is important to be included with a realistic feed of information from the operations, such as the equipment position and estimated time for finishing a job.
An example of this second step is a recent comparison we carried out between manually-driven shuttle carriers (SHC), automated shuttle carriers (ALV) and Lift-AGV’s. All in combination with an automated high density yard, operated by ARMGs. In terms of productivity, all three systems achieved the same performance level (40 net bx/h), but with different equipment numbers. In a peak operation the ratio between SHC, ALV, and L-AGV was 2.5 - 3.5 - 4 (per QC). The automated equipment is more sensitive to the density of the operation in terms of operating speed. Subsequently, one needs to compare the CAPEX required for each system, as well as the OPEX and understand key risk factors to coma to an evaluation of such systems. A simulation detailing such can be taken further to civil design questions on pavement design, electric system requirements but also detailed kinematic characteristics of equipment and TOS functionality specifications.

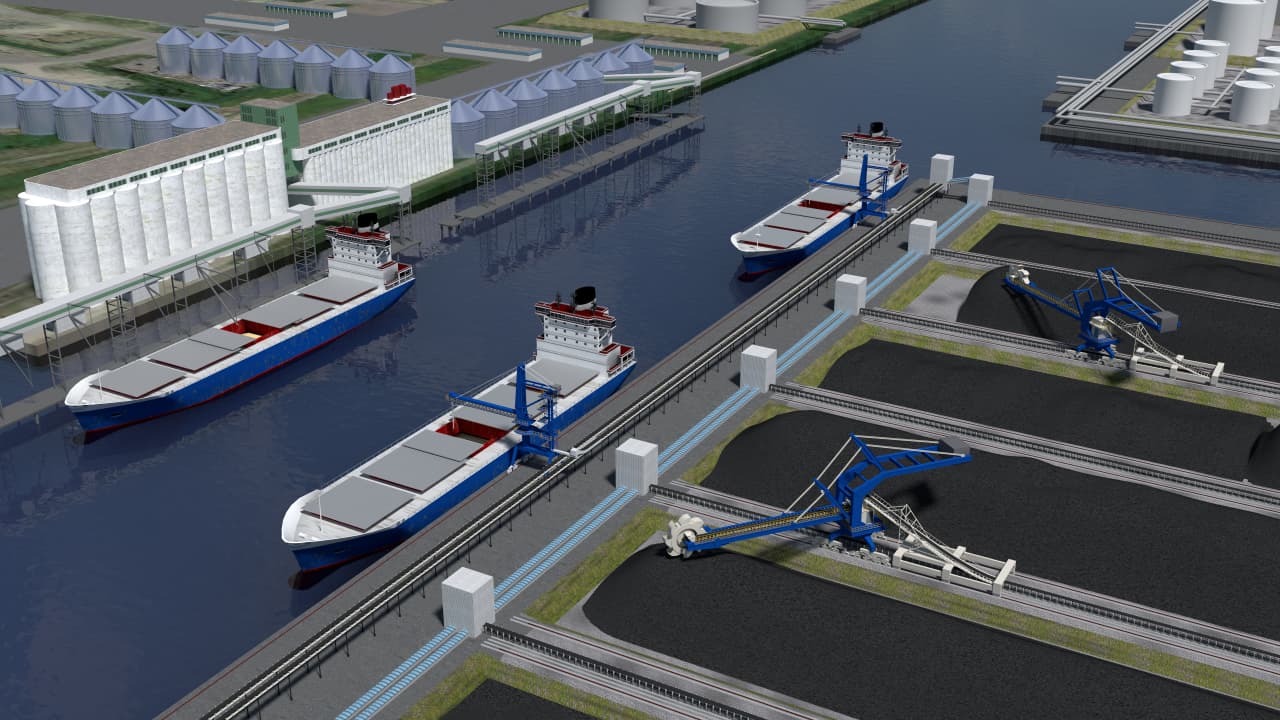
Example view within a simulation model of operations using an automated rail mounted gantry crane (ARMG) and automated guided vehicles (Lift-AGV)
Optimise the day-to-day operation
Although everyday operations at a container terminal differs from that of the day before, it is worthwhile to explore the possibilities of using models to improve such operations. The models are getting more comprehensive and are able to capture real operational procedures and handle real operational data. They can also depict processes at the level of individual container moves around the terminal and represent decisionmaking around grounding containers based on a container’s profile. With these models we see a great opportunity to apply them in the analysis and replay of past operations and in the pre-planning of upcoming operations. In this way, we can address questions around equipment usage and manning given a certain operation at a quay, rail and gate, as well as decisions concerning the in-advance preparation of the yard. Similarly operational procedures, namely equipment pooling, sharing part of the equipment, real-time re-allocation of equipment, and sizing the gangs, together with strategies and patterns for yard operations in terms of yard density, travel distance and unproductive moves (shuffles).
The outcome of these analyses can be fed back into the TOS functionality specifications, and into the minds of the managers, planners, dispatchers, and operators, running the terminal. It can overcome the often contradictory perceptions of the bottlenecks in the current operation, and prioritize improvement measures. Thanks to the use of real data and operations, the value of these exercises heavily increases, because it becomes much easier to translate the result back into the consequences for coming operations. Examples of the recent findings comprise the effect of equipment pooling (15% increase of equipment productivity and therefore the potential for reducing operating costs), and the effect of an improved RTG assignment and yard grounding strategy (20% less equipment required on average with the productivity level remaining at the same level).
The essence of arriving at models that can accomplish this added value is a good understanding of the operation, including the rules in the terminal operating system. An alternative to overcome cumbersome modelling of TOS functionality is to link the simulation environment directly to the system. In this set-up, the simulation represents all the physical processes, the TOS uses the real container data to control the operation. By doing so, it can be configured much faster to accomplish a smooth and performing operation under various conditions.
Operations at container terminals are highly complex, but automation makes them even more complex. Optimisation tools treating the operation as a deterministic process are difficult to apply because in real-time the operation differs highly from the planned situation due to the dynamic processes, weather delays and human intervention. Therefore, tools that explicitly consider the dynamics of a life operation should be favoured over others. Simulation is such a tool, able to represent and visualise container terminal operations – both the physical processes and the rules in the terminal operating system.
Applying simulation makes the decisions concerning the investment in quay and quay cranes, the choice of handling system, and the configuration of a terminal’s control system better founded, better to understand, and more transparent to follow. It enables a terminal operator to reduce the risk of developing a new terminal or improving an existing one for similar or changing circumstances. If simulation is applied, one should make sure that the specific characteristics of an operation are validly represented in the model. Otherwise, the risk of nice pictures over sound results lies just around the corner.
This article has been published in Harbours Review June 2017
Share this
Using simulation and emulation throughout the life cycle of a container terminal
Making the transition to digital